Visualisation to convert times to other time zones
I volunteer with the PASS Business Intelligence Virtual Chapter who run free technical training sessions on BI topics based on Microsoft technologies.
Lately PASS as an organisation has been positioning itself as a truly global representative of the SQL Server community. As part of that push the BI Virtual Chapter has been scheduling live sessions that run at times all across the world and giving opportunities for local speakers to showcase their talents.
Traditionally the listed time for a session has been the local time of that speaker. For example sessions that I’ve organised are always run at 12pm Brisbane time. Now if you live in Brisbane or even Australia then working out when the session is running is relatively easy, but for everyone else it’s not so simple.
When I have to work out what time something is running in my local time here in Australia I usually have to go through a process of using the Time Zone converter at timeanddate.com, finding the time zone that it’s being run in, and then converting it to my local time.
For example if a session is running at 12pm EST in the US, I first have to find the right EST.
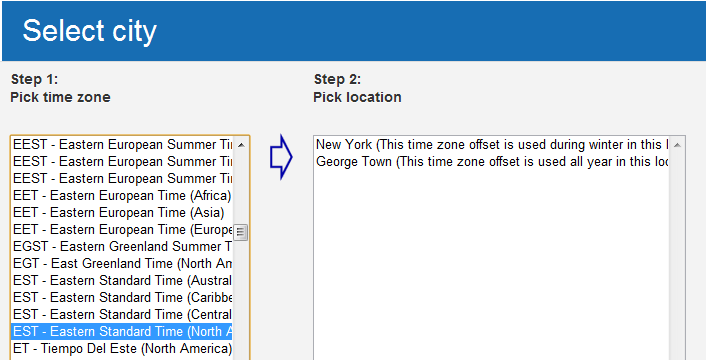
Not only are there multiple EST’s listed (and the full description is obscured) but when the North American EST is selected there is a second choice of location. In this case I always pick New York because to be honest it’s the only place on the list I’ve heard of (although I’m sure George Town is a nice place). Once selected I then convert it to my local time only to discover that it’s at 1:30am…
Before going any further I have to say that timeanddate.com provide an excellent service and I use it all the time. But I feel that this process is overly complicated when at the very least I’d like to know if I’ll be asleep or not.
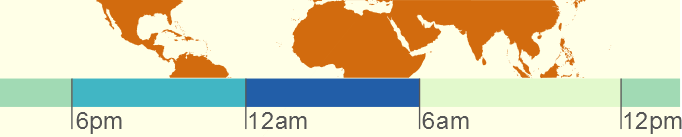
My proposed solution is to produce a simple visualisation that displays the approximate time a session is being run at any point across the world. The goal is to quickly communicate a close enough time at a glance. If the time looks good then the user can investigate further and perform the actual conversion. In the example below the session has been listed as 12pm EST.
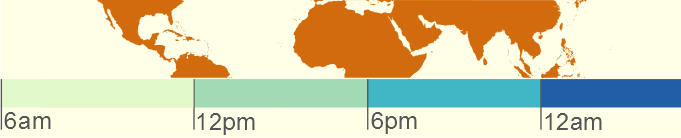
You may have noticed that the map has been significantly cropped - not to offend, but to show a section of the world that is both easily identifiable and space saving. The idea is to produce a visualisation that communicates an approximate time for an approximate location. In fact contrary to most visualisations this chart is inaccurate by design. If you’ve ever looked at a map with the time zones marked you’ll notice that they don’t fall into evenly distributed bands, in most cases the time depends more about the country you live in rather than the position of the sun above it.
Based on the example chart I can very easily tell that this session is running when I’ll hopefully be asleep, saving myself around ten clicks and one browser tab. However if I live in the UK I can see that the session falls at the end of the working day, in which case working out the exact time will be worthwhile.
To further reduce the total number of clicks a user must perform the image will link to the Event Time Announcer at timeanddate.com (http://timeanddate.com/worldclock/fixedtime.html?iso=20120821T12&p1=179) which not only lists all capital cities, but reduces the total number of clicks to a maximum of one.
The map was sourced (with thanks) from vectorworldmap.com. The sequential colours were sourced from colorbrewer2.org and were chosen so they don’t loose meaning for those who are colour-blind. Finally the visualisation was put together with Inkscape.
The plan is to start using these little visualisations for each scheduled sessions that the BI Virtual Chapter runs and I’m keen to get any feedback - positive and negative. So what do you think?